
 Delaware (USA)
  Vietnam
  Singapore
  Hong Kong
  United Kingdom
 A Gantt chart is one of the most essential and powerful tools in modern project management, providing a clear visual representation of a project's timeline. This horizontal bar chart is the cornerstone of project planning, scheduling, and tracking, offering an at-a-glance overview of who is doing what, when, and how tasks connect. Let’s discover its core definition, history, and practical steps for creating and using one effectively in this article.
This article explains the key concepts of a Gantt chart, helping businesses and project managers gain a clearer understanding of how it supports effective planning, scheduling, and progress tracking. We specialize in company formation and not in project management software or consulting. For technical guidance on project planning, please consult a qualified expert.
What is a Gantt chart?
A Gantt chart is a visual project management tool that displays a project's schedule over time. It uses a horizontal bar chart format to show the start and end dates of all project tasks, their durations, and task dependencies. The vertical axis of the chart lists the tasks that need to be completed, while the horizontal axis represents the project timeline. Each task is represented by a horizontal bar; the length of the bar corresponds to the task's duration, and its position on the timeline shows when it will occur. Dependencies between tasks are often shown as arrows or lines connecting the bars, indicating the order in which tasks must be performed.
This visual layout allows project managers and team members to instantly grasp critical information, such as task dependencies, project milestones (usually marked with diamond shapes), and overall progress. Think of it as a roadmap for your project, showing not just the destinations (tasks) but the roads connecting them (dependencies) and the time each part of the journey will take. This clarity is fundamental to aligning teams and stakeholders on a unified plan. Additionally, the chart helps identify potential bottlenecks and monitor progress in real time, improving overall project control.
History of the Gantt chart
The Gantt chart has a rich history that dates back over a century, cementing its place as a foundational element of modern management theory. While it is named after American engineer and management consultant Henry Gantt, its origins can be traced back to Polish engineer Karol Adamiecki. In 1896, Adamiecki developed a precursor to the Gantt chart he called the harmonogram, a visual tool for scheduling work. However, his work was published in Polish and Russian, limiting its reach.
Independently, around 1910, Henry Gantt began popularizing his own version of the bar chart in the Western world. He designed his charts to help manufacturing supervisors see whether their work was on schedule, ahead of schedule, or behind schedule. This innovation was revolutionary, providing a level of clarity and control previously unavailable. The tool proved its immense value on large-scale, complex projects like the construction of the Hoover Dam in the 1930s. Since then, the Gantt chart has become a standard project management tool used across various industries worldwide.
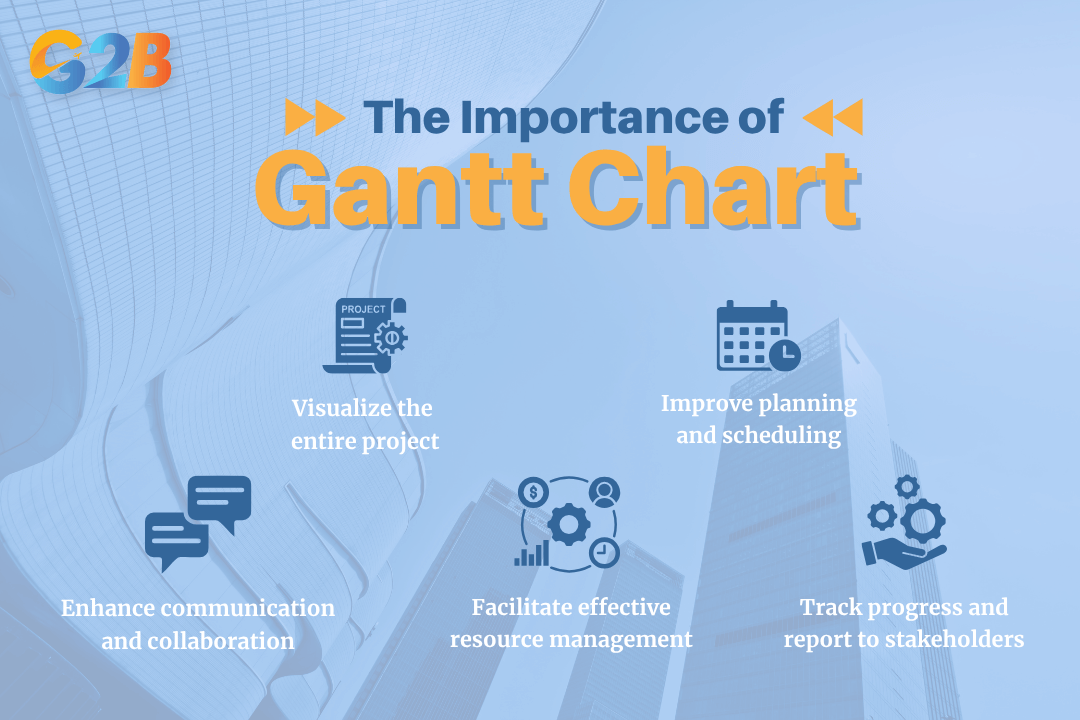
Why Gantt charts are essential in business
Gantt charts are a foundational tool for effective project planning and resource management because they translate complex project details into a clear, digestible format. For foreign investors looking to register a company in Vietnam, using a Gantt chart can streamline project timelines and ensure smooth coordination between legal, administrative, and operational tasks.
Gantt charts are a foundational tool for effective project planning
Visualize the entire project
A Gantt chart’s greatest strength is its ability to provide a high-level overview of the entire project on a single timeline. This "single source of truth" allows project managers and stakeholders to see the start and end dates for every task, identify critical dependencies, and understand the project's overall trajectory at a glance. Imagine launching a new marketing campaign. A Gantt chart provides a single source of truth, showing everything from initial market research and content creation to ad deployment and performance analysis on one clear timeline.
Improve planning and scheduling
The structured format of a Gantt chart forces a logical approach to planning. It requires you to break down a large project into smaller, manageable tasks and think critically about how long each task will take and in what order they must be completed. This process uncovers potential roadblocks and scheduling conflicts before they occur, allowing for more realistic and accurate timelines.
Enhance communication and collaboration
Clear communication is the bedrock of successful teamwork. Gantt charts serve as a common visual language that everyone on the team can understand. They clarify roles, responsibilities, and deadlines, ensuring every team member knows what is expected of them and when. When the design team can see that the content team is delayed, they immediately understand the impact on their own start date, fostering proactive communication instead of reactive problem-solving. Effective communication is the backbone of project success, a principle we emphasize in our business process consulting services.
Facilitate effective resource management
Gantt charts help managers allocate resources, such as team members, equipment, and budget, more effectively. By visualizing the timeline, a project manager can see who is assigned to each task and avoid over-allocating any single resource. This ensures a balanced workload, prevents team burnout, and helps keep the project on budget. For example, a chart might reveal that one developer is assigned to three overlapping tasks, signaling the need to reassign work to keep the project on track.
Track progress and report to stakeholders
Modern Gantt charts excel at progress tracking. As tasks are completed, the bars can be shaded in to show the percentage of work finished. This provides an immediate visual indicator of the project's health. This visual progress reporting is invaluable for keeping stakeholders informed. Instead of dense spreadsheets, you can present a clear and simple chart that instantly communicates project status and highlights key milestones, while facilitating timely adjustments to the project plan.
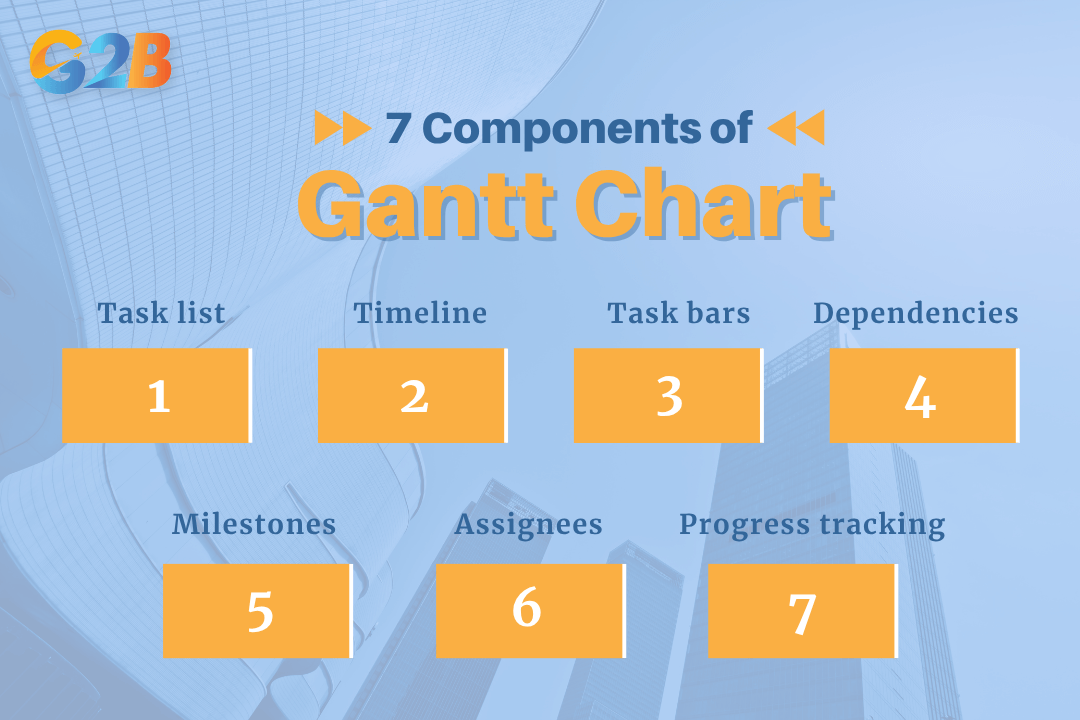
Main components of a Gantt chart
To read and build a Gantt chart effectively, it is crucial to understand its core elements. Each component provides a specific layer of information that contributes to the chart's overall utility.
Each component provides a specific layer of information
- Task list: This is the vertical list of all activities and tasks that must be completed to finish the project. Tasks are typically organized chronologically or grouped into larger phases.
- Timeline: The horizontal axis at the top of the chart that represents the project's duration, broken down into increments like days, weeks, or months. Depending on the project's scale, the timeline can be adjusted to finer or broader increments such as hours or quarters.
- Task bars: These are the horizontal bars that represent each task. The length and position of a bar indicate the task's start date, end date, and overall duration.
- Dependencies: These are the vital links that connect tasks that are reliant on one another. The most common type is 'finish-to-start,' meaning one task must be fully completed before the next one can begin. Other common dependency types include start-to-start and finish-to-finish. Dependencies are usually shown as arrows or lines connecting the task bars.
- Milestones: These are significant events, deadlines, or deliverables in the project lifecycle. Represented as diamonds or other distinct shapes, milestones have zero duration and serve as markers for major progress points, such as "Project Kickoff" or "Final Approval."
- Assignees: This column indicates the team member or department responsible for completing a specific task. While format may vary by software, clearly assigning ownership is crucial for accountability and task management.
- Progress tracking: This feature shows how much of a task has been completed. It is often visualized as shading within the taskbar or a percentage marker, providing an at-a-glance view of the project's status against the planned schedule (the baseline). Sometimes progress is compared with baseline timelines to assess deviations.
How to apply Gantt charts to business
Creating and implementing a Gantt chart is a structured process that transforms a project's scope into an actionable plan. Following these steps will help you build a clear and effective chart for any business initiative.
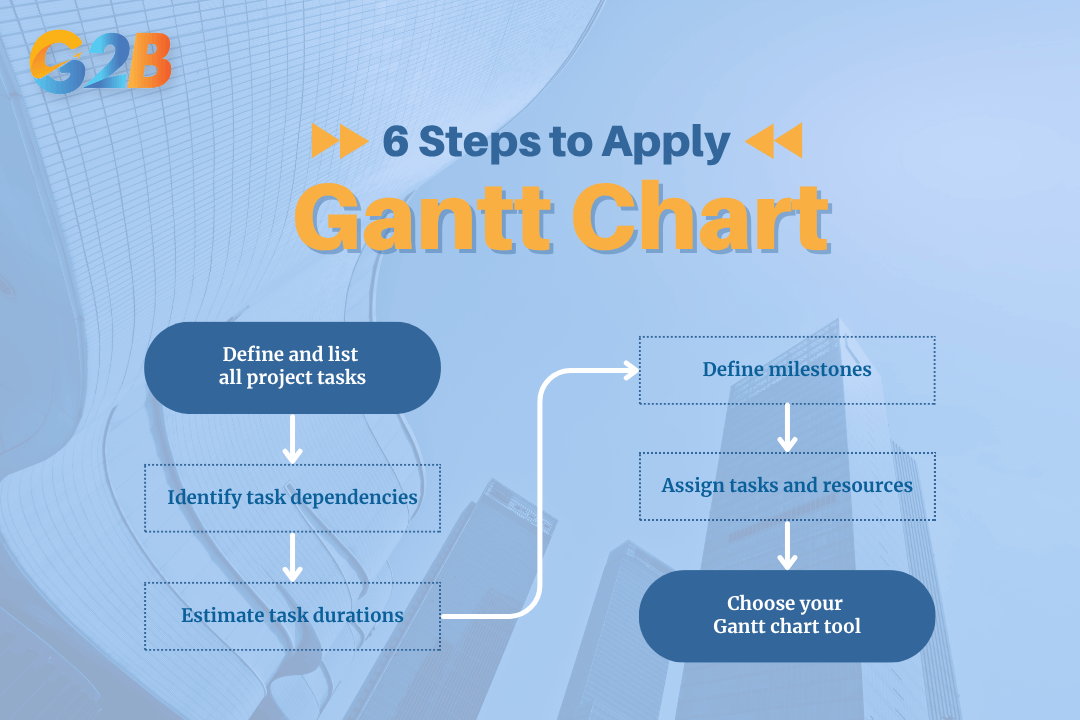
6 steps will help to build a clear and effective chart
- Define and list all project tasks: The first step is to identify every activity required to complete the project. A useful technique here is to create a Work Breakdown Structure (WBS), which involves breaking down the main project deliverable into smaller, more manageable sub-tasks. This ensures no detail is overlooked.
- Identify task dependencies: Once you have your task list, determine the relationships between them. Ask which tasks must be completed before others can begin (finish-to-start), which can happen at the same time (start-to-start), and which must end together (finish-to-finish). This sequence forms the logical backbone of your project.
- Estimate task durations: For each task, estimate how much time it will take to complete. It is best practice to consult with the team members who will be performing the work to get the most accurate estimates. Be realistic and consider potential delays or obstacles.
- Define milestones: Identify the major checkpoints or deliverables in your project that signify significant progress. These could be the completion of a major phase, a client approval, or a product launch. It is helpful to specify expected dates or times for these milestones to facilitate progress tracking.
- Assign tasks and resources: Assign each task to a specific team member or department. This step ensures clear accountability and helps with managing workloads.
- Choose your Gantt chart tool: Once you have your plan, the final step is to choose the right tool to bring it to life. This could range from a simple spreadsheet template to sophisticated project management software, depending on the complexity of your project and the needs of your team. For complex projects, accurately estimating time can be challenging.
Popular Gantt chart creation tools
The right tool can make all the difference in managing a Gantt chart effectively. The choice depends on factors like project complexity, team size, budget, and desired features.
For beginners and simple projects
- Excel and Google Sheets: For small projects with few dependencies, a spreadsheet can be a great starting point. They are highly accessible and require no additional software investment. Numerous free templates are available that can be customized. However, they are limited in functionality; they are not ideal for real-time collaboration, lack automated dependency adjustments, and must be updated manually, which can be time-consuming and prone to errors.
- Trello (with Power-Ups): While Trello is primarily a Kanban-style tool, its "Power-Ups" (integrations) like Planyway or BigGantt can add Gantt chart functionality to its simple, card-based interface. This is a good option for teams who already use and love Trello for task management but need a way to visualize their project timeline.
For professional project management
- Microsoft Project: Often considered the industry standard for complex project management, Microsoft Project offers robust and powerful Gantt chart features. It excels at detailed planning, resource management, critical path analysis, and in-depth reporting. Its steep learning curve and higher cost make it best suited for certified project managers and large, intricate projects.
- Asana: Asana is a popular project management tool known for its user-friendly interface. Its "Timeline" feature is a beautiful and intuitive Gantt chart that makes it easy to map out project plans and adjust schedules with drag-and-drop functionality. Asana is excellent for teams that need strong collaboration features alongside powerful planning capabilities.
- Monday.com: This Work OS (Work Operating System) is highly visual and customizable. Monday.com's Gantt view allows teams to manage complex projects and visualize dependencies in a flexible and collaborative environment. It's well-suited for a wide range of industries and team sizes due to its adaptability.
- Jira (with add-ons): Jira is the go-to tool for software development teams, particularly those using Agile methodologies. While its native capabilities are focused on sprints and backlogs, powerful marketplace add-ons like BigGantt or WBS Gantt-Chart for Jira transform it into a fully-featured project scheduling tool, bridging the gap between agile execution and long-term roadmap planning.
The Gantt chart is far more than just a simple bar chart; it is a dynamic and indispensable ally for any team striving for project excellence. From its historical origins to its modern digital form, it has consistently proven its value in providing clarity, improving communication, and enabling meticulous planning and tracking. By visualizing tasks, dependencies, and timelines, the Gantt chart demystifies project complexity and aligns everyone - from team members to stakeholders - on a single, coherent plan.

